The problem
If you run availability reports or performance reports with a aggregation type of daily or hourly the reports are empty. This problem is described a lot on the web. And I have also written a couple of blog post how to fix this issue. But as you know we are using scom to monitor stuff , so why not monitor this aggregation processing and alert if a processing delay is occurring. ? That’s our mission today….
Analyze
Using SQL enterprise manager and a SQL query on the data warehouse DB we can read out the aggregation processing. This query looks like this:
|
Select AggregationTypeId, Datasetid, (Select SchemaName From StandardDataSet Where Datasetid = StandardDataSetAggregationHistory.Datasetid) , COUNT(*) as ‘Count’, MIN(AggregationDateTime) as ‘First’, MAX(AggregationDateTime) as ‘Last’ From StandardDataSetAggregationHistory |
The output will show us how many aggregations there have still to be processed /aggreationtype (20=hourly , 30 = daily).
So in this case we have no problem. But I have seen scom environments where the state aggregations where so far behind that it was almost not possible to fix it. This bring up a point: especially the state aggregations are the tricky ones. If you have many ‘flipping’ monitors there will be a lot of state changes and so a lot of aggregations data to process. This process takes a lot of SQL CPU power and also disk space. In most of this cases it was the tempdb data space free or transaction log that was the root cause of the failure.
Solution
In scom we have for every aggregation an target. This target is named ‘Standard data set’. You can find it here:
If you compare the screenshot with the results on your scom console you will notice that you don’t have the green healthy state… And that’s why you are reading this post. So lets add this state.
I wanted to give every dataset that has to be processed a health state on how many aggregation it has still to process. So we make a monitor that executes for every data set the query above and if a threshold is hit the health state is changed. Also we will add a rule so that this aggregation behind count is put in a trend graph.
I have used VSAE for this , and I will not share the code but only the idea. Why not ? I believe you have to know what you are doing and by copy & pasting you don’t learn from it if you don’t have done it once from start till end.
The real work
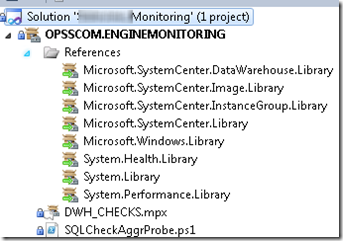
Open a new VSAE project and add a empty MP fragment and a PowerShell fragment.
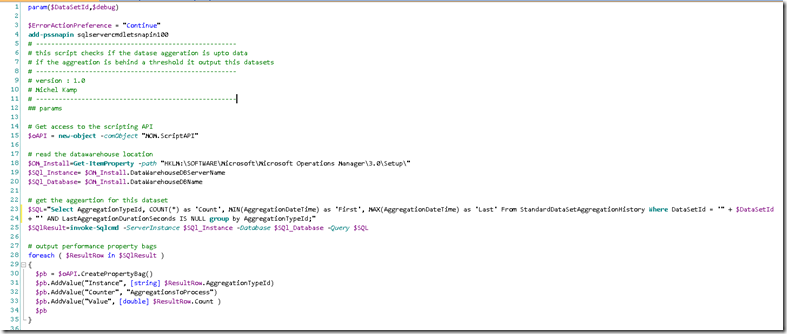
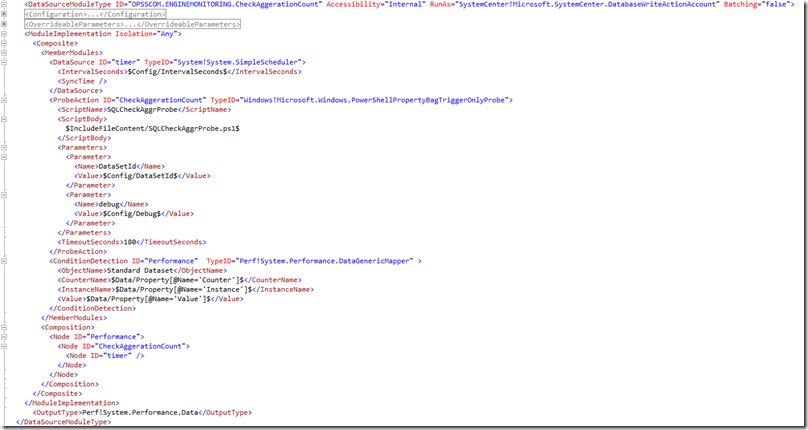
Then you make a datasource that reads the aggregation count. This is done using PowerShell and the SQL snapin.
The PowerShell script has as input the GUID of the dataset (property of the target) and as output a property bag with the aggregations count (daily and hourly). I made the script somewhat intelligent by reading out the registry where the data warehouse is located.
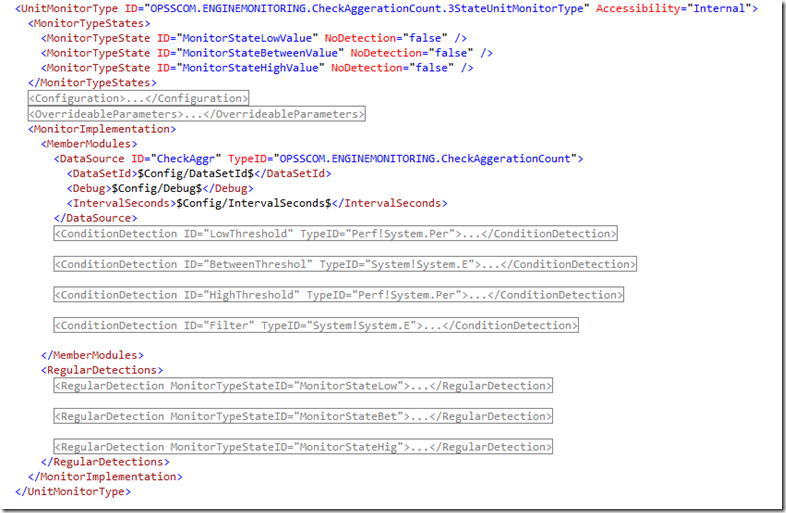
Now we use this datasource in a monitor module type to create a 3 state monitor. And since we have created a datasource module we can create also a rule that collects the aggregation behind for the trend graph. Yes know know this is easier to type as to do…
Below a snap of the datasource module
And below a snap of the monitor module type
and the monitor. Create one for hourly(not shown) an one for daily.
At last for trending we have to create a collection rule.
Notice that the monitor and collection rule are having as target the “Microsoft.SystemCenter.DataWarehouse.DataSet” alias “standard dataset” and notice the runas profile.
The result
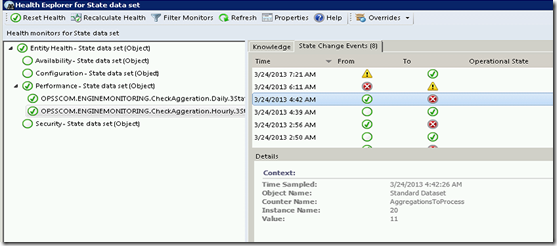
When you have constructed the MP and build/deployed it you will see 2 extra monitors on the standard dataset targets as show above. Open the health explorer to see if all is ok.
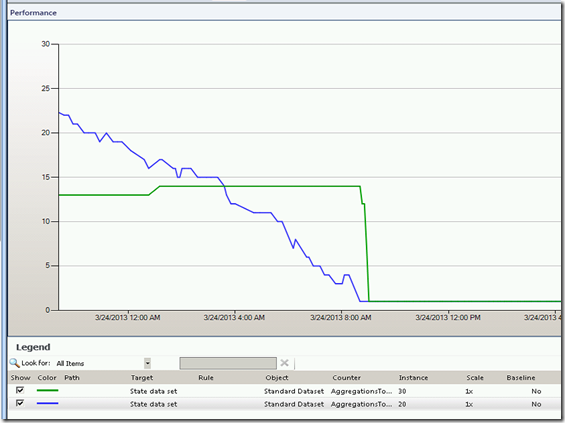
Above dataset has had a problem. To see some details, view the performance counters and you will see the aggregations trend.
In this case the state hourly aggregations where way behind. So I followed one of my own blog posts to solve this one. Where I manually executed in a loop the state aggregation process to speed up the processing.
The End.
Yes I know this post is a bit ‘çloudy’ and not something you can download and import. But I hope by sharing the idea I triggered you to try it your self.
Happy SCOMMING!
Michel Kamp




Great Stuff…Thx
-M.Mathew
Thank you, I have just been searching for info about this topic for ages and yours is
the greatest I’ve discovered so far. However, what about the conclusion? Are you sure in regards to the supply?
Very nice post. I just stumbled upon your weblog
and wished to say that I have really enjoyed surfing around your blog posts.
After all I will be subscribing to your feed and I hope you write again soon!
What’s up, just wanted to say, I liked this blog post. It was helpful. Keep on posting!
I was suggested this web site by way of my cousin. I’m not certain whether this post is written by way of him as nobody else understand such designated about my problem. You’re wonderful!
Thanks!
Good day! Would you mind if I share your blog with my twitter
group? There’s a lot of folks that I think would really enjoy your content. Please let me know. Many thanks
Thanks , I’ve recently been looking for info approximately this topic for a while and yours is the best I have found out so far.
But, what about the conclusion? Are you positive in regards to the supply?